Oxford Economics’ WACC Methodology Informs Australia’s Green Energy Transition
Oxford Economics Australia delivered robust, scenario-based discount rate and WACC estimates developed through macroeconomic modelling, industry stakeholder surveys, and benchmarking to inform the Australian Energy Market Operator’s 2025 IASR and 2026 ISP.
Background: Estimating Investment Viability for Future Energy Infrastructure Is Complex and Uncertain
Australia’s energy transformation requires massive investment across diverse technologies. But consistent, independent cost of capital benchmarks—vital to evaluate project viability and compare technologies—were lacking across regulated, unregulated, and emerging sectors.
The Challenge: Capturing Sector-Specific Financial Realities and Future Scenarios Across Technologies
AEMO needed differentiated and forward-looking cost of capital insights across 13 technologies from utility-scale solar to offshore wind and hydrogen—to accurately model and compare future energy investments under three ISP scenarios.
The Solution – Enhanced WACC modelling for informed system planning
Delivering Independent Discount Rate and WACC Estimates Backed by Market Modelling and Sector Input Oxford Economics Australia delivered:
- A rigorous methodology using macroeconomic data, a national stakeholder survey (108 orgs invited), and global benchmarks to ensure sector relevance and confidence.
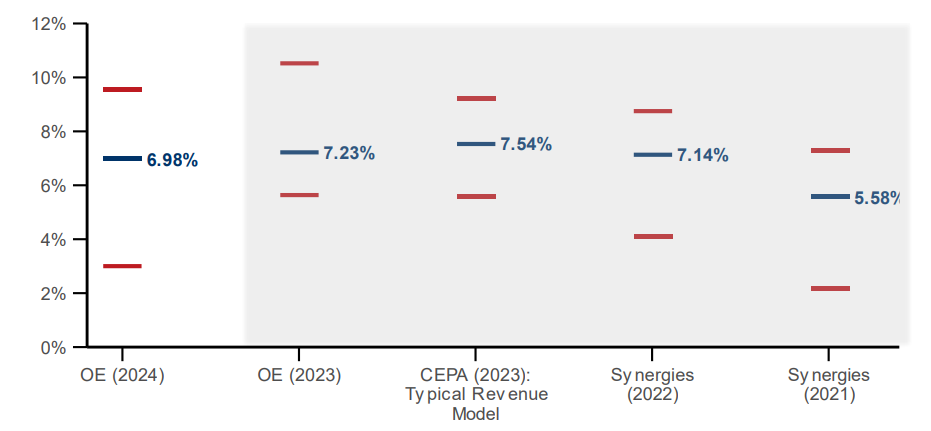
- A technology-neutral discount rate of 7.0% (real, pre-tax), with scenario sensitivity (6.4% to 8.3%) and upper/lower bounds (3.0% to 9.5%) based on RBA data and credit spread analysis.
- Technology-specific WACC estimates for 13 energy asset classes (e.g. 7.0% for utility-scale solar, 8.5% for pumped hydro, 12.0% for coal) tailored to project financing conditions.
- Three-scenario forward projections (Progressive Change, Step Change, Green Energy Exports) showing how financing costs may shift with policy and inflation trends.
Impact: These inputs will directly support AEMO’s system-wide modelling for Australia’s 20-year electricity investment roadmap, enabling consistent, defensible cost assumptions across technologies.
Fig. 1. Technology neutral real pre-tax discount rate estimates
The experts behind the research
-
 Kristian Kolding
Managing Director - Consulting, OE Australia
Kristian leads Oxford Economics Australia's Consulting team, working with public and private sector leaders to help them prepare for the future by applying relevant economic theory and forecasts to inform effective policy and business strategy development.
-
 Alex Hooper
Head of Climate & Energy Economics, OE Australia
Alex is a macroeconomist with over a decade of experience, she currently leads Oxford Economics' climate & energy economics practice.