Lower-income states and metros face the greatest burden from impending tariffs


Tariffs act as a regressive tax on households as they are applied to imported goods, many of which fall into the category of non-discretionary spending on such things as clothing, food, and energy—necessities most households cannot go without. Consequently, low-income households spend a larger share of their wages on these non-discretionary goods and would suffer to a greater degree from new tariffs. As would senior households, who tend to live on fixed incomes, and those living in areas with high housing costs.
The status of tariff proposals changes weekly, if not daily. The newest policy calls for applying a 25% tariff on all steel and aluminum imports. Earlier this month, the administration imposed a 10% additional tariff on Chinese imports on top of the pre-existing 10% to 25% tariffs on Chinese imports. This new tariff will increase the effective tariff rate on Chinese exports to the US from 10.4% to 20.4%, as we recently reported. We estimate that US goods imports from China totaled $594 billion in 2024 and accounted for 18.6% of all US goods imports. Thus, a 10% added tariff would effectively add a near $60 billion surcharge to all imported goods.
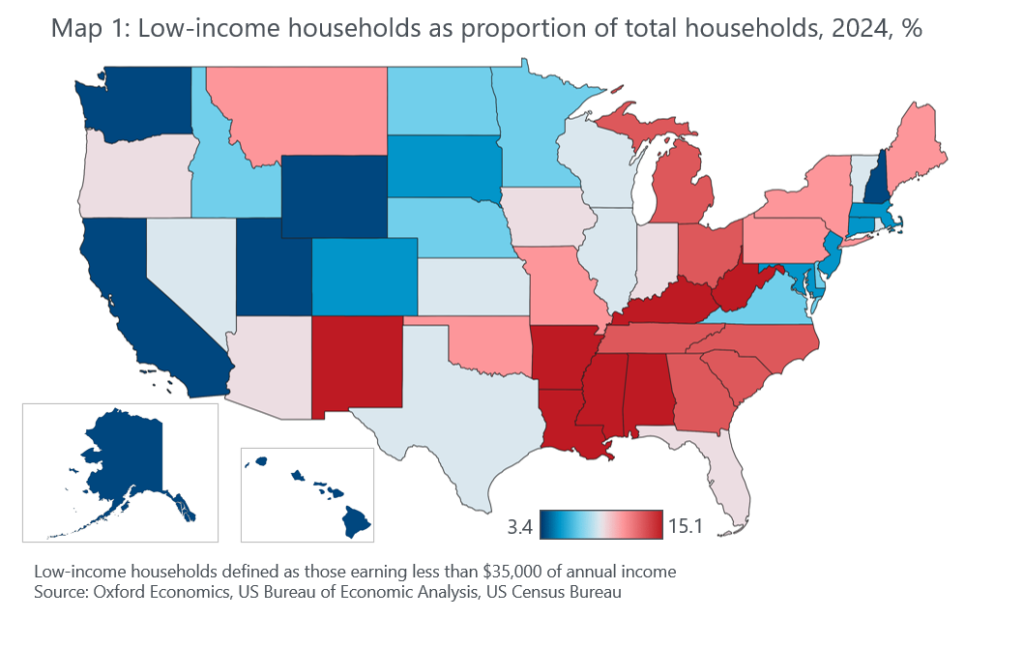
While the steel and aluminum tariffs will raise costs on autos and other manufactured goods, the broader tariffs on Chinese imports will have more of a direct impact on household spending—especially for low-income households. As Map 1 indicates, states with the highest share of low-income households—shown in red—tend to be in the South (Mississippi, Alabama, Louisiana, and Arkansas) or Appalachia (Kentucky and West Virginia). These states have a lower share of high-paying jobs such as those in finance, tech, and professional services, and a higher share of jobs in healthcare, retail, and state and local government which typically pay lower-than-average salaries. Thus, as tariffs are expected to raise costs, and as low-income households consume a relatively greater share of their income, households in these red states will suffer the most.
Southern states have a greater share of low-income households
States with high housing costs and more seniors will suffer the most from tariffs
As Map 2 illustrates, households living in the states shown in red tend to spend a disproportionately high share of their wages on non-discretionary goods—including housing, food, clothing, and fuel. Our global trade data show that nearly 19% of total US goods imports in 2024 came from China, including roughly 22% of all US food and clothing imports. Thus, with the added 10% tariff on Chinese goods, households in these red states will be hit the hardest as they spend more of their aggregate wages on necessities, many of which are now subject to the new tariffs.

Although Florida has fewer low-income households than other southern states, households in Florida spend a high share of their wages on non-discretionary goods. Not only are housing costs considerably higher in Florida than in much of the South, but many people here work in low-paying, tourism-related sectors—more so than in most other states. Wealthier retirees skew the numbers a bit because they do not earn wages, yet many seniors are on fixed incomes and are subject to the added tariffs on food, clothing, and energy on which they now will have to spend a large share of their income.
Note how Maine, Montana, Hawaii, South Carolina, and Idaho are also red. The same inflationary effects of the new tariffs will hit these states, just as in Florida, and they also have high and fast-growing housing costs. In addition, Maine, Montana, Hawaii, and South Carolina have a large share of seniors as well as a high concentration of tourism-related employment. Thus, residents here would suffer more so from tariffs as they would have to allocate a greater share of wages/income on non-discretionary spending.
Certain Florida and California metros most exposed to tariffs
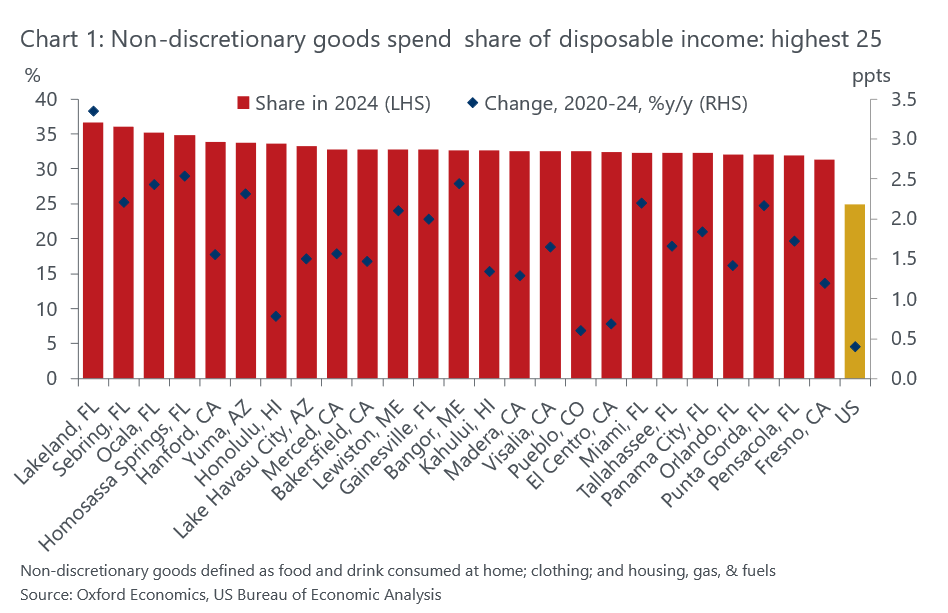
Looking at non-discretionary spending as a share of total disposable income on a metro level, Chart 1 shows how metros in Florida and California would endure the worst impacts from tariffs. Again, most of these Floridian metros have a large share of tourism-related jobs and relatively high housing costs, while those in California also have high housing costs and many low-paying, agriculture-related jobs. Thus, the smaller, more rural metros in these states would bear a greater burden from tariffs than other metros.
Earlier in February, Trump temporarily suspended a sweeping 25% tariff on all Canadian and Mexican goods imports. Such tariffs would raise the effective tariff rate to 20.7% on Canadian exports to the US and 25.3% on Mexican exports, up from a historic low of less than 1%. Should these tariffs occur, the state and metros mentioned above would feel the inflationary effects to an even greater extent. Although the US is a net exporter of oil (crude and refined), it still imports much of the oil it consumes. Our estimates show that 72% of all US fuel imports in 2024 came from Canada, and another 4% came from Mexico. Thus, a potential tariff on Canadian imports would raise energy prices, in addition to food and clothing costs.
As we recently reported, our February baseline forecast incorporated the 10% increase in tariffs on imports from China. It also included a new blanket 10% tariff on imports from the EU beginning next quarter as well as more aggressive targeted tariffs on Canada and brought forward the rest of the tariffs we envisaged over the next few years to mid-2025.
Author

Tags: